
Risk-based thinking for ISO 9001, where data sets the stage
A risk register usually gets written just before an audit and then nobody touches it for a year. Here risks are alive: each has an owner, a review date and treatment tied to an action plan - so at year’s end you show not just a list of risks, but what you did about them and how they moved.
Risks and opportunities per ISO 9001 (clause 6.1) · FMEA with Action Priority per AIAG-VDA · linked to action plans
You have the risks. Not the system.
Every department keeps its own spreadsheet, versions drift apart and nobody knows which risks are actually treated and which are just written down.
One time it's a matrix, another time FMEA, each with a different scale. The results can't be compared or defended in front of an auditor.
A treatment gets agreed for a risk, but nobody tracks whether it was implemented and whether the risk actually dropped. Residual scoring is missing.
The Risk Management module gives every risk one process, one set of scales and one piece of evidence: what threatens you, what you’re doing about it and how much the risk dropped.
Not new screens. A different way of working.
The audit stops being a sprint
Evidence of reviews, treatments and their effectiveness builds up continuously. A week before the audit, nobody scrambles to reconstruct what was actually done with the risks.
Risks have an owner and a date
Every record carries a responsible person and a next-assessment deadline. Gone is the state where quality owns the register and the rest of the company knows nothing about it.
Leadership gets an overview, not a list
A matrix and a breakdown by category show where risk concentrates. The leadership discussion is about the three most serious items, not eighty rows.
You can tell whether the company's profile is improving
The score before and after treatment gives your improvement projects a measurable result you can show even to a customer.
Six steps. The stage follows the data.
What the auditor and leadership ask, and what you answer
You score the way your customer demands
Where probability times impact is enough, you use a matrix. Where an automotive customer requires FMEA logic, you score by severity, occurrence and detection with Action Priority per AIAG-VDA. You don't have to run two systems for it.
Two scoring methodsYou cover even the part of the standard companies skip
ISO 9001 speaks of risks and opportunities. An opportunity is scored with the same matrix - Impact simply becomes Benefit and the polarity flips - and has its own strategies: exploit, enhance, share, accept. At the audit you're not explaining why the register covers only half of clause 6.1.
Risks and opportunitiesLeadership sees the map, the owner sees their list
A board by stage for daily work, a risk map for the leadership meeting and a filtered table for analysis, with a management Risk Overview on top. Same data, no retyping into a presentation.
Three views of the registerFor every risk it's clear what you're doing about it
The 4T strategy names the decision: mitigate, transfer, tolerate or terminate. Leadership doesn't read a list of threats, but a list of decisions the company has committed to.
4T treatment strategyA risk doesn't end in a table - it gets a task and a deadline
Treatment runs as measures and tasks in a linked action plan, with a responsible person, a deadline and effectiveness verification. Only once all are verified does the system request a residual assessment, and the Risk Reduction KPI shows the shift in score.
Measures in action plansThe annual review happens even when nobody remembers it
An assessment campaign groups the risks of a process, a category or the whole company, assigns a lead and participants, keeps notes on each risk and ends with a signed conclusion. The list shows the status of every campaign and which one is overdue.
Review campaignsA new plant doesn't start from an empty table
A catalog of typical risks and opportunities gives a new operation or process a proven starting point. The methodology spreads across the company on its own, without training every individual.
Template catalogThe register reflects not just the workshop, but the shop floor too
Risks arise at specific action plans as well. One that outgrows a single plan you escalate to the company register with one click; its treatment keeps running where it's actually handled.
Escalation from action plansThe methodology is yours, not the software vendor's
You set the scales, color bands and categories to match your own directive. The score calculation then applies equally to all users and plants, so the numbers can be compared.
Custom scales and bandsYour company’s whole risk profile on one screen
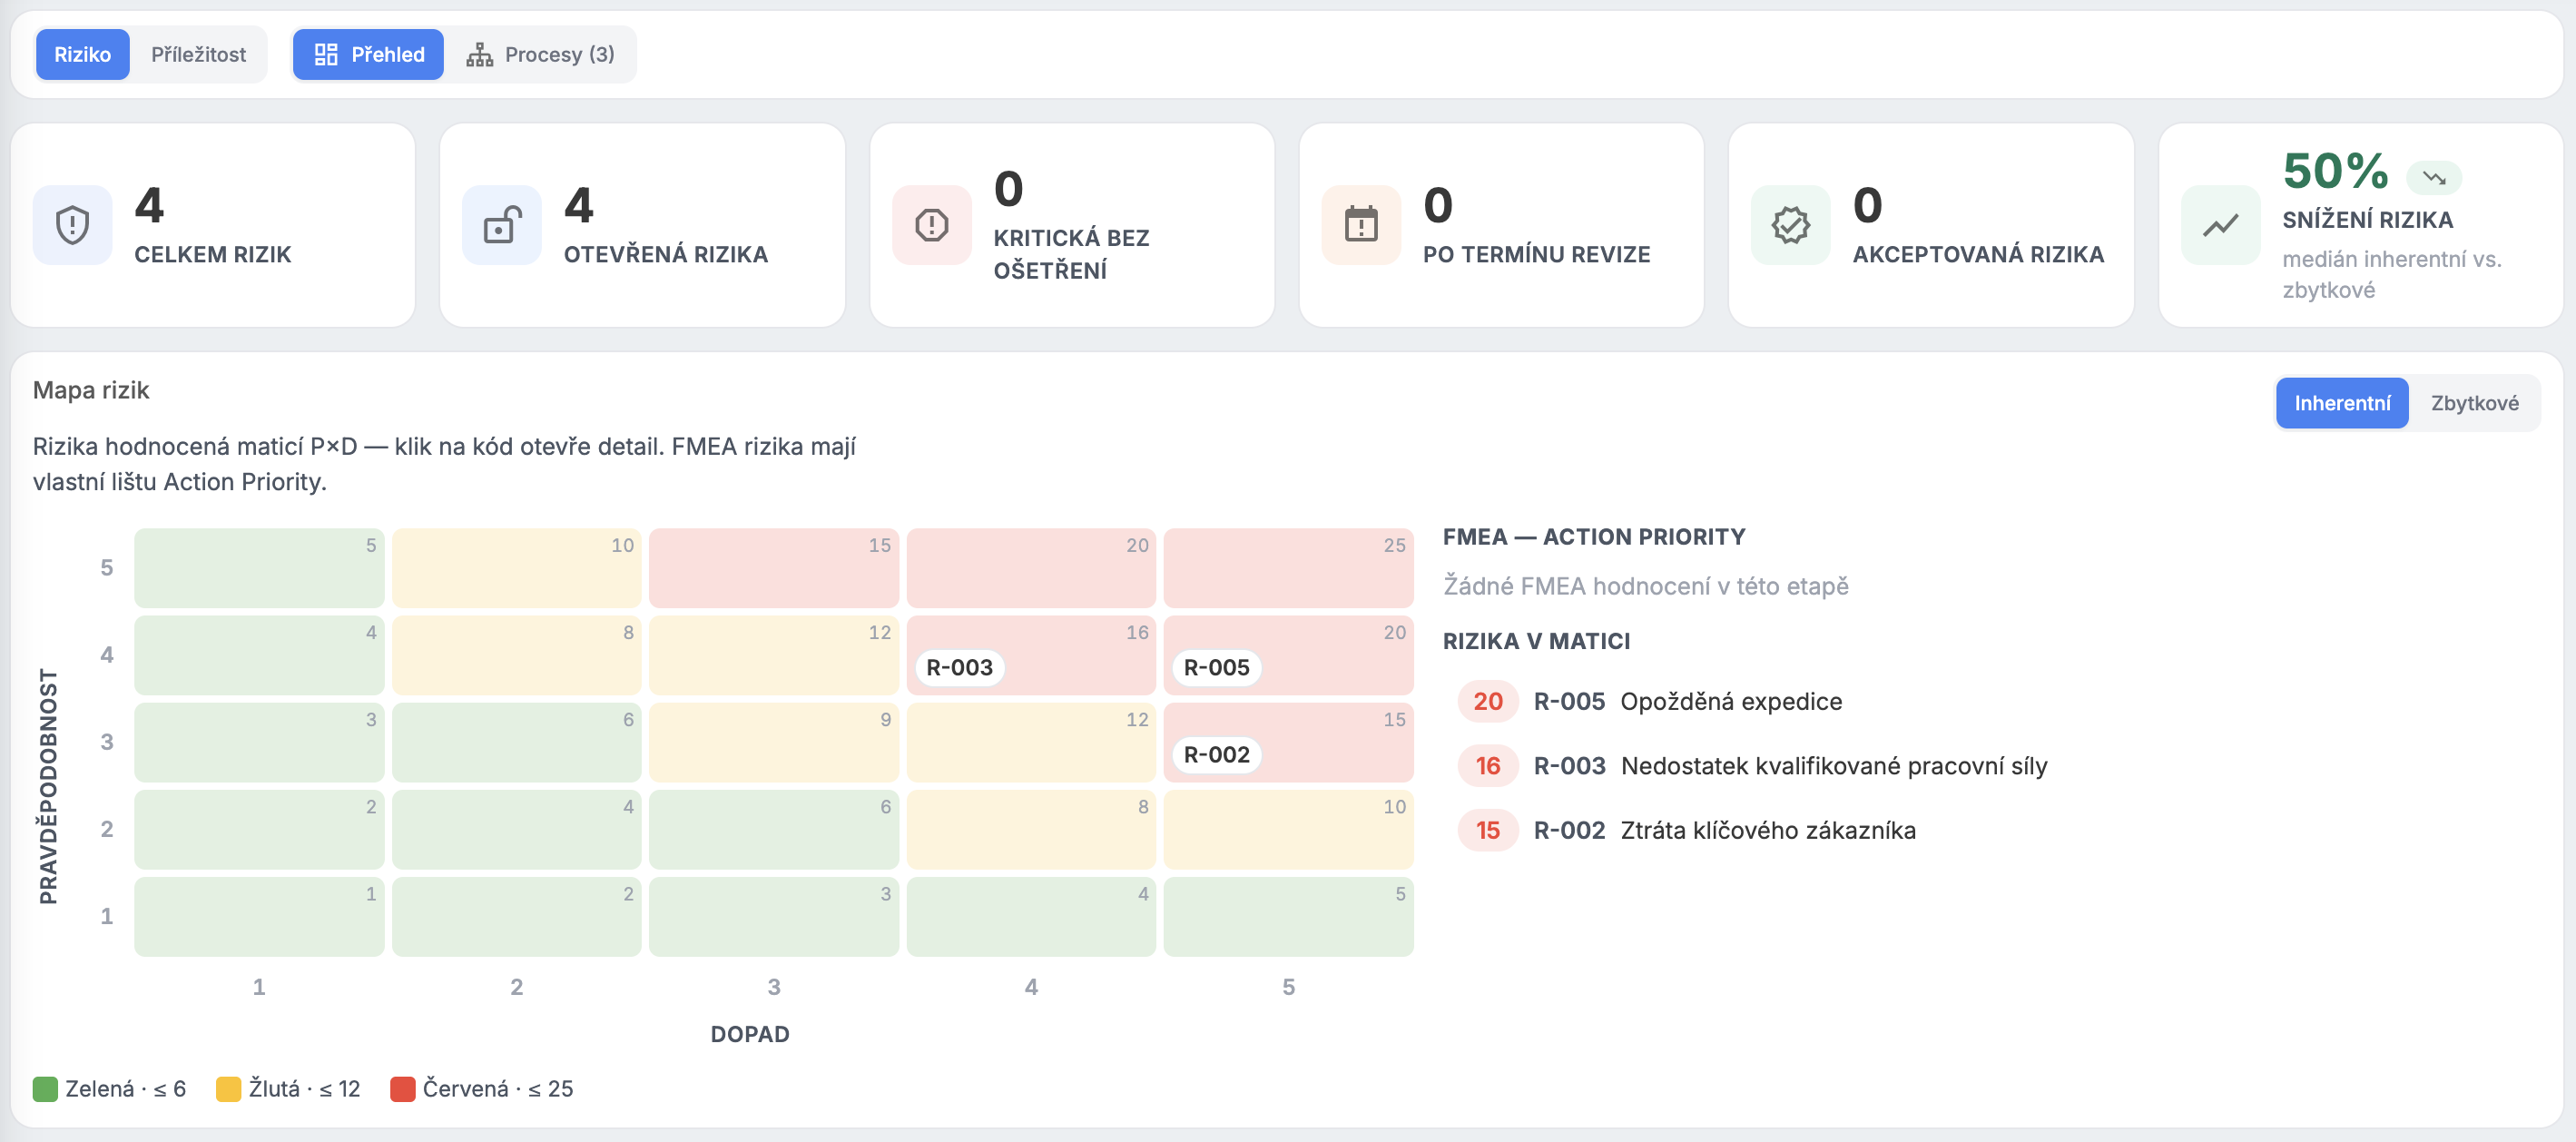
The risk map shows matrix risks in a Probability × Impact grid with color bands and an Inherent / Residual toggle. FMEA risks get their own Action Priority bar.
- Inherent / Residual toggle: the same map before and after treatment. The difference is obvious at a glance.
- Click a chip to open the risk detail: from the map there's a direct path to the process dialog, measures and history.
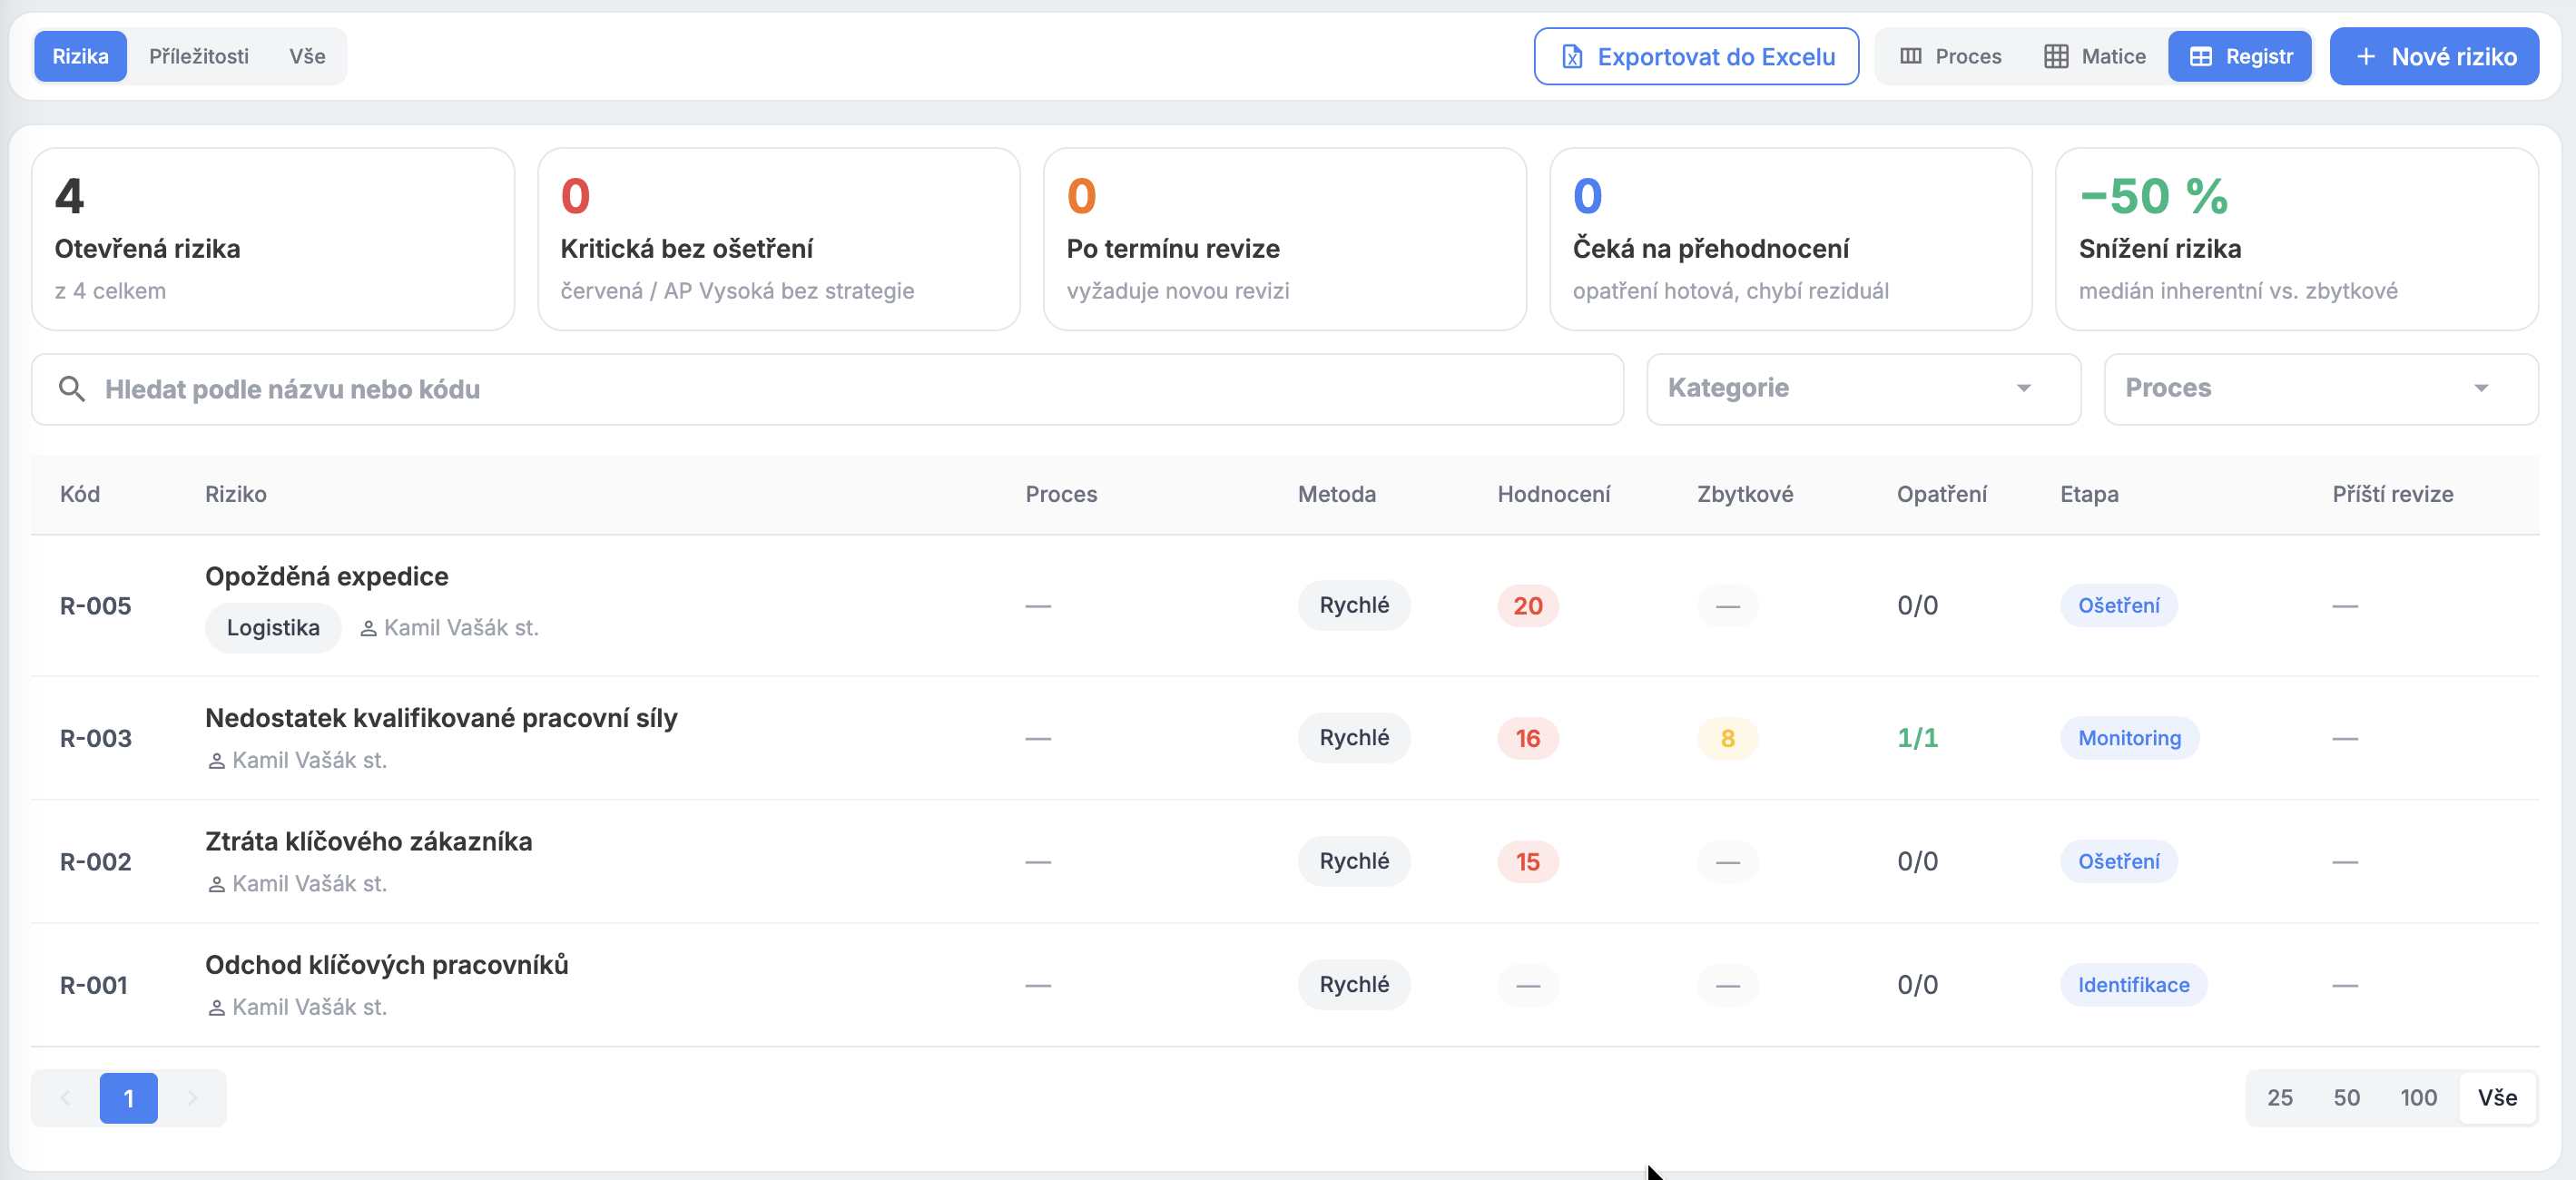
- Export to Excel: the whole register with one button, unfiltered and up to 500 risks, for the leadership meeting and the auditor alike.
- Share by link: an open risk detail is reflected in the URL, so you send a specific risk to a colleague as a link.
What each role gets out of it
Owns the risk system and certification
- An ISO 9001 register including opportunities, provable at the audit
- Review campaigns with notes on risks and a signed conclusion
- FMEA logic with Action Priority for automotive customers
Decides on the company's exposure
- A risk matrix and a breakdown by category instead of an eighty-row table
- The 4T strategy shows what the company has committed to for each risk
- The shift in score over time as proof the profile is improving
Turns risks into projects
- Measures as action-plan projects with deadlines and ownership
- The Risk Reduction KPI measures the effect of the implemented measure
- A risk from an action plan can be escalated to the company register
Own the risks of their operation
- A filter by process and category, so they see only their part of the register
- Risks past their review date are highlighted red and counted by a KPI tile
- The template catalog eases assessing a new process or line
Frequently asked questions
Yes, at inherent assessment. The app warns that the scales differ (matrix 1-5 vs. S/O/D 1-10) and, for Severity and Occurrence, offers an indicative conversion from the matrix that you must confirm with a click. Nothing fills itself in. The residual assessment inherits the method.
They share the same process and scales, but for an opportunity the polarity flips (a higher score = more attractive, green), the Impact field becomes Benefit and the strategies become Exploit, Enhance, Share, Accept. Closing an opportunity has no blocking gate.
Access is governed by three role permissions: View risks (read-only), Manage risks (creating, scoring, strategy, acceptance, closure) and Administer risks (catalogs and the category code list). Scales and bands are set by the global administrator.
A risk in the acceptable band, yes. A risk outside the acceptable band requires either treatment with a residual assessment, or a conscious acceptance with a justification and a signature that is written permanently into the history.
Both ways. A company risk is treated with action-plan measures and their status is reflected back into the register. Each action plan also has its own Risks tab, and serious items can be escalated to the company register.
Yes, the whole register exports to Excel with one button (up to 500 risks). Each risk’s detail also carries the complete history of assessments, strategies, measures and reviews.
We’ll do it on your risks, not on a demo
Book a no-obligation online demo. We’ll take three risks from your existing register, score them with your methodology, attach measures and show what the register will look like a year from now at your next audit.